

Maya Lian
Maya Lian is a senior at Pinewood School with expertise in Java and Python coding. She currently holds a leadership position in Pinewood’s robotics team and uses her skills in programming, math, and art to transform concepts into reality.

Public Data Project
Our project aims to make the dense, jargon-filled financial reports of the cities around us accessible to everyone through visualization. We hope to let more people know about the past and the status quo of these cities. We have delved deeper into Santa Clara County and its cities: Sunnyvale, Mountain View, and Cupertino.
Feel free to click through our Power BI dashboards! If you have any questions, we have coded a chatbot.
Explore the dashboardsMaya Lian is a senior at Pinewood School with expertise in Java and Python coding. She currently holds a leadership position in Pinewood’s robotics team and uses her skills in programming, math, and art to transform concepts into reality.

Aiden Zhang is a junior at Basis Independent Silicon Valley. He is passionate about serving local communities and creating meaningful impact. He leverages his programming, data visualization, and digital humanities skills to address community needs and empower others.

Russell Wang is a junior at Homestead High School. He is interested in data science and economics. Currently, he is a co-president of Homestead’s Data Science Club and is proficient in both Python and Power BI.

Selena Zhang is currently a freshman at Homestead High School, where she has enjoyed studying mathematics through advanced coursework and participating in math competitions. She also has an interest in programming, data science, and art and uses her skills on community-focused projects.
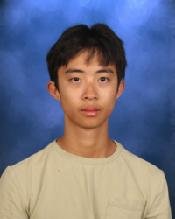
I Huan Chao, a senior at Homestead High School. He enjoys math, programming, and physic, interested in mathematics, physics, and coding. Currently, he holds a leadership position in the Math Club and is proficient in both Java and Python.

Annie Yu is a junior at the Harker School. She serves as a chair on CompassPoint Mentorship’s Sustainability committee, and she is passionate about environmental science, civic access, and youth voice in policy. Currently, she also serves on the Youth Advisory Commission for the City of Milpitas, and coaches Middle School Science Bowl at the Harker Middle School.
The Multi-City Financial Performance Power BI tool is developed to analyze and visualize public finance data using the Annual Comprehensive Financial Report (ACFR).
It provides a structured, multi-layered view of fiscal performance, enabling users to explore:
This Power BI tool supports seamless navigation from summary-level insights to detailed financial breakdowns within a single integrated dashboard.
